Elasticity of Demand in Public Health Economics:
Elasticity of demand measures the responsiveness of quantity demanded to changes in price. It helps us understand how sensitive demand is to price changes. The concept of elasticity is crucial in public health economics as it supports healthcare providers about how changes in price (cost) can impact the utilization of public health services.
Different types of elasticity are relevant in public health economics:
1. Price Elasticity of Demand (PED): This measures the percentage change in the quantity demanded of a good or service in response to a one percent change in its price. If the demand is elastic (PED > 1), a small price change leads to a proportionally larger change in quantity In the context of public health, services with elastic demand might see significant changes in utilization when prices are adjusted.
2. Income Elasticity of Demand (YED): This measures the responsiveness of quantity demanded to changes in income. It indicates whether a good or service is a normal good (positive YED) or an inferior good (negative YED). In public health, understanding income elasticity helps tailor interventions to specific income.
3. Cross-Price Elasticity of Demand (XED): This measures the responsiveness of the quantity demanded of one good to a change in the price of another good. In the context of public health, this can help understand how changes in the price of one health service affect the demand for another.
1. Price Elasticity of Demand (PED) in Health Economics:
Price Elasticity of Demand (PED) is a vital concept in health economics that measures the sensitivity or responsiveness of the quantity demanded of a healthcare good or service to changes in its price, while keeping other factors constant. It gauges how much the demand for a health-related product or service changes in response to a percentage change in its price.
The formula for calculating Price Elasticity of Demand (PED) is as follows:
PED = Percentage Change in Quantity Demanded/ Percentage Change in Price
Where:
% Change in Quantity Demanded = % Change in Quantity Demanded represents the percentage change in the quantity of the healthcare good or service demanded.
% Change in Price = % Change in Price represents the percentage change in the price of the healthcare good or service.
Types/Degrees of Price Elasticity of Demand in Health Economics:
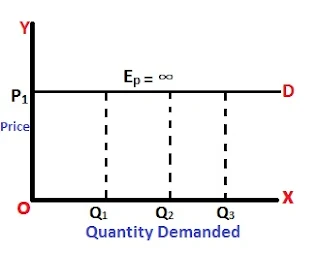
1. Perfectly Elastic Demand (Ep = ∞): Perfectly elastic demand occurs when a slight change in the price of a healthcare product or service leads to a significant change in its demand. This extreme elasticity is rare in the context of healthcare. For instance, if the price of a widely essential medication decreases slightly, the demand might surge dramatically.
In the above figure, P1D represents a perfectly elastic demand curve which is parallel to the x-axis. It shows that at price OP1 quantity demanded may be OQ1, OQ2, or OQ3.
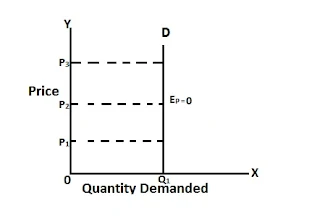
2. Perfectly Inelastic Demand (Ep = 0): Perfectly inelastic demand arises when changes in the price of a healthcare good or service do not affect its quantity demanded. Essential medical supplies like life-saving drugs or critical medical equipment often exhibit perfectly inelastic demand – individuals require them regardless of price fluctuations.
In the above figure, Q1D is perfectly inelastic demand. It is parallel to the y-axis. It shows that at price OP1, OP2, OP3, the quantity demanded remains unchanged. I.e.OQ1
3. Unitary Elastic Demand (Ep = 1): Unitary elastic demand occurs when the percentage change in quantity demanded matches the percentage change in price. For instance, if the price of a health-related device increases by 10%, and the demand decreases by 10%, the demand is unitary elastic.
In the above figure price and quantity are shown along y-axis and x-axis respectively. DD represents the demand curve which is unitary elastic. I.e. equal to 1
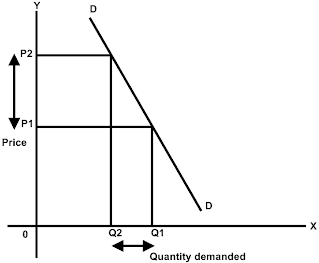
4. Relatively Elastic Demand (Ep > 1): Relatively elastic demand occurs when the percentage change in quantity demanded is greater than the percentage change in price. Luxurious health services like cosmetic surgeries or elective procedures might demonstrate relatively elastic demand. A small change in their prices could lead to a proportionally larger change in demand.
In the above figure price and quantity are shown along y-axis and x-axis respectively. When price changes from P1 to P2 then, quantity demanded changes from Q1 to Q2 but by a greater proportion than price. The demand curve DD is relatively elastic. I.e. Ep > 1.
5. Relatively Inelastic Demand (Ep < 1): Relatively inelastic demand happens when the percentage change in quantity demanded is less than the percentage change in price. Necessities like emergency medical care, essential medications, or life-saving treatments typically exhibit relatively inelastic demand. Even if their prices rise, individuals still require them for their health and well-being.
In the above figure price and quantity are shown along y-axis and x-axis respectively. When price changes from P1 to P2 then, quantity demanded also changes from Q1 to Q2 but by less proportion than price. The demand curve DD is relatively inelastic. I.e. Ep < 1.
2. Income Elasticity of Demand (YED) in Health Economics:
Income Elasticity of Demand (YED) is a crucial concept in health economics that measures the responsiveness of the quantity demanded of a healthcare good or service to changes in consumer income, while keeping other factors constant. YED helps us understand how changes in income levels influence the demand for healthcare products and services.
The formula for calculating Income Elasticity of Demand (YED) is as follows:
YED = Percentage Change in Quantity Demanded/ Percentage Change in Income
Where:
% Change in Quantity Demanded = % Change in Quantity Demanded represents the percentage change in the quantity of the healthcare good or service demanded.
% Change in Income = % Change in Income represents the percentage change in consumer income.
Types/Degrees of Income Elasticity of Demand in Health Economics:
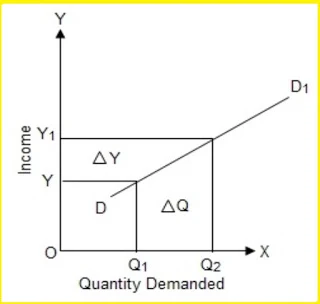
1. Normal Goods (YED > 0): A positive YED value indicates that a healthcare good or service is a normal good. As consumers’ incomes increase, the demand for these goods or services also increases. Non-essential health-related items like elective surgeries, cosmetic treatments, and wellness programs often fall into this category. For example, as individuals’ income rises, they may be more likely to invest in elective procedures that enhance their appearance.
In the above figure income and quantity demanded are shown along the y-axis and x-axis respectively. When income level rises from Y to Y1, the quantity demanded also increases from Q1 to Q2. DD1 is the demand curve that is positively elastic in nature. i.e. EY > 0
2. Luxury Goods (YED > 1): When the YED value is greater than 1, it indicates that the healthcare good or service is a luxury good. These are highly responsive to changes in income. High-end healthcare services, exclusive wellness retreats, or specialized medical treatments might be considered luxury goods. If individuals experience a significant increase in income, they may allocate a larger portion of it to such luxury health services.
In the graph above, a 5% increase in income from OY1 to OY2 results in a 10% increase in quantity demanded from OQ1 to OQ2. DD is the demand curve where income elasticity is larger than one.
3. Necessity Goods (0 < YED < 1): Necessity goods have a positive but less than 1 YED value. These are healthcare products or services that individuals continue to demand even as their income increases, albeit at a slower rate. Basic healthcare services, prescription medications, and essential medical equipment often fall under this category. As income grows, the demand for these goods also increases, but not as drastically as luxury goods.
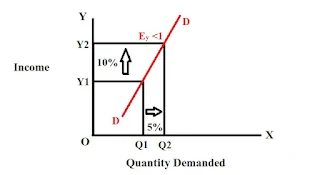
In the graph above, a 10% increase in income from OY1 to OY2 results in a 5% increase in quantity demanded from OQ1 to OQ2. DD represents the demand curve whose income elasticity is less than unity.
4. Inferior Goods (YED < 0): An inferior good has a negative YED value. As individuals’ income increases, the demand for these goods decreases. In the context of health economics, this could apply to certain low-cost, low-quality healthcare products that individuals might replace with higher-quality alternatives as their income rises.
In the preceding graph, the y-axis and x-axis represent income and quantity, respectively. When income falls from OI to OI0, demand grows from OQ to OQ1. DD is the demand curve that demonstrates negative elasticity. I.e. EY < 0
3. Cross Elasticity of Demand (XED) in Health Economics:
Cross Elasticity of Demand (XED) is a significant concept in health economics that measures how the quantity demanded of a healthcare good or service changes in response to a change in the price of a related good or service, while keeping other factors constant. XED helps us understand the interrelationships between different healthcare products and services.
The formula for calculating Cross Elasticity of Demand (XED or EXY) is as follows:
Where:
% Change in Quantity Demanded of Good A = % Change in Quantity Demanded of Good A represents the percentage change in the quantity of healthcare good or service A demanded.
% Change in Price of Good B = % Change in Price of Good B represents the percentage change in the price of healthcare good or service B (the related good).
Types/Degrees of Cross Elasticity of Demand in Health Economics:
1. Positive Cross Elasticity (XED > 0): A positive XED value indicates that healthcare goods A and B are substitutes. If the price of healthcare good B increases, the demand for healthcare good A increases, and vice versa. For example, if the price of generic medications (good B) rises, individuals may switch to cheaper alternatives, such as over-the-counter drugs (good A), leading to an increase in the demand for the latter.
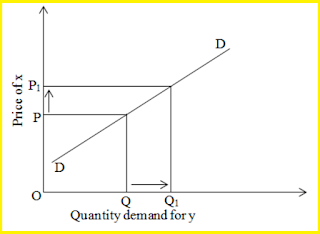
Along the y-axis and x-axis of the above graph, the price of x goods and the demand for y goods are represented, respectively. When the price of good x increases from P to P1, the demand for good y increases from Q to Q1. The positively cross-elastic demand curve is denoted by DD.
Thus, EXY > 0
2. Negative Cross Elasticity (XED < 0): A negative XED value suggests that healthcare goods A and B are complements. An increase in the price of healthcare good B leads to a decrease in the demand for healthcare good A, and vice versa. In health economics, this could apply to services like doctor consultations (good A) and prescription medications (good B). If medication prices rise, patients may reduce their demand for doctor visits.
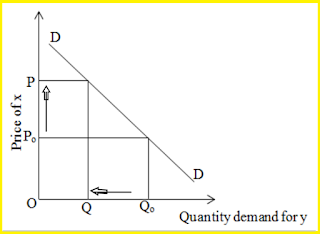
Along the y-axis and x-axis of the above graph, the price of x goods and the demand for y goods are represented, respectively. When the price of x goods increases from P0 to P, the quantity demanded for y goods falls from Q0 to Q. DD is the positively cross-elastic demand curve. Consequently, EXY is less than zero.
3. Zero Cross Elasticity (XED = 0): A XED value of zero indicates that healthcare goods A and B are unrelated. Changes in the price of one healthcare good have no effect on the quantity demanded of the other. For instance, the price of eyeglasses (good B) might not significantly impact the demand for dental services (good A).
The price of y goods and demand for x goods are depicted along the y-axis and x-axis, respectively, in the above graph. When the price of y goods increases from P1 to P2 and then to P3, there will be no change in demand for x goods. QD is the demand curve whose cross-elasticity is zero. i.e., EXY=0









Please leave your comments or ask your queries here. The comments shall be published only after the Admin approval.