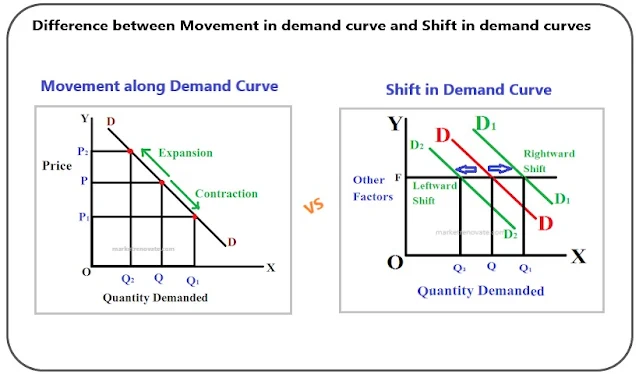
Movement in demand curve Vs Shift in demand curves
Movement along a demand curve and shift in demand curves are two distinct concepts that help us understand changes in consumer behavior and market dynamics. Movement along a demand curve refers to changes in the quantity demanded due to variations in the price of a product, while other factors remain constant. It occurs within the boundaries of the existing curve and represents a change from one point to another on the same curve. The movement showcases the inverse relationship between price and quantity demanded, as dictated by the law of demand.
On the other hand, a shift in demand curves occurs when there are changes in the entire quantity demanded at every given price level. It reflects factors beyond just changes in price, such as alterations in consumer preferences, incomes, market conditions, or external influences. A shift in demand curves is depicted by the movement of the entire curve either to the right (indicating an increase in quantity demanded) or to the left (indicating a decrease in quantity demanded). It signifies a new relationship between price and quantity demanded, resulting from various factors that impact consumer behavior.
While movement along a demand curve focuses on the impact of price changes on quantity demanded, shifts in demand curves provide insights into broader changes in consumer behavior and market dynamics. Analyzing movements along the demand curve helps us understand the effects of price fluctuations, while examining shifts in demand curves allows us to identify and respond to changes in consumer preferences, incomes, and external influences beyond price.
Difference between Movement in demand curve and Shift in demand curves
| S.N | Movement along a Demand Curve | Shift in Demand Curves |
|---|---|---|
| 1. | Change occurs along the existing curve. | Entire curve shifts either to the right or left. |
| 2. | Caused by changes in price while other factors remain constant. | Caused by factors beyond just changes in price. |
| 3. | Represents a change in the quantity demanded. | Reflects changes in the entire quantity demanded at various price levels. |
| 4. | Occurs within the confines of the original demand curve. | Involves a new demand curve that represents a different relationship between price and quantity demanded. |
| 5. | Shows an inverse relationship between price and quantity demanded. | Can result in an increase (rightward shift) or decrease (leftward shift) in the quantity demanded at any given price. |
| 6. | Depicted by a movement from one point to another on the same curve. | Illustrated by the shifting of the entire curve to a new position. |
| 7. | Factors affecting movement are changes in price only. | Factors affecting shifts can include changes in consumer preferences, incomes, market conditions, and other external influences. |
| 8. | Movement is represented by a change along the x-axis (price) of the graph. | Shift is indicated by a horizontal shift of the entire curve. |
| 9. | Movement does not alter the overall demand curve. | Shift changes the entire demand curve, indicating a new relationship between price and quantity demanded. |
| 10. | Analyzing movement helps understand the impact of price changes on quantity demanded. | Analyzing shifts provides insights into changes in consumer behavior, market dynamics, and external influences beyond price. |
- Why is the short-run cost (SAC) curve U-shaped?
- Ricardian Theory of Rent Under Extensive and Intensive Cultivation
- The effect of income changes on consumer choices
- Cobb Douglas Production Function - Equation - Importance
- Difference between Movement in demand curve and Shift in demand curves
- Movement in Demand Curves and Shift in Demand Curves
- Individual Demand Curve and Market Demand Curve
- Law of Demand with Table and Diagram
- Difference Between Desire and Demand
- Determinants of Demand
- Demand and its Types


Please leave your comments or ask your queries here. The comments shall be published only after the Admin approval.